Managing cloud environments just got smarter. With Azure Monitor, you gain real-time visibility into your applications, infrastructure, and services—making performance optimization, troubleshooting, and security easier than ever.
What Is Azure Monitor and Why It Matters

Azure Monitor is Microsoft’s comprehensive observability platform designed to collect, analyze, and act on telemetry data from both cloud and on-premises environments. Whether you’re running virtual machines, containers, or serverless functions, Azure Monitor provides a unified solution for monitoring performance, availability, and usage across your entire tech stack.

As organizations increasingly shift to hybrid and multi-cloud architectures, the need for centralized monitoring tools has never been greater. Azure Monitor fills this gap by offering deep integration with Azure services while also supporting third-party tools and platforms through open standards like OpenTelemetry.
Core Components of Azure Monitor
Azure Monitor isn’t a single tool—it’s an ecosystem of interconnected services that work together to deliver full-stack observability. The main components include:
Metrics: Numerical values that describe aspects of a system at a point in time (e.g., CPU usage, memory consumption).Logs: Structured and unstructured data collected over time, stored in Log Analytics workspaces for querying and analysis.Application Insights: A feature within Azure Monitor that provides deep monitoring for live applications, including web apps, microservices, and APIs.Activity Log: Tracks subscription-level events such as resource creation or deletion, helping with compliance and auditing.Alerts: Proactive notifications triggered when specific conditions are met, enabling rapid response to issues.These components can be used individually or in combination, depending on your monitoring needs.For example, if you’re focused on application performance, Application Insights will be your go-to tool.
.If you need infrastructure-level insights, Metrics and Logs are essential..
How Azure Monitor Fits Into Modern DevOps Practices
In today’s fast-paced development cycles, DevOps teams rely on continuous feedback loops to ensure system reliability and performance. Azure Monitor integrates seamlessly into CI/CD pipelines and DevOps workflows via APIs, PowerShell, and Azure CLI.
Teams use Azure Monitor to track deployment health, detect regressions, and automate responses to incidents. For instance, after deploying a new version of an application, engineers can use dashboards and alerts to verify that error rates remain low and response times stay within acceptable thresholds.
Moreover, Azure Monitor supports Infrastructure as Code (IaC) practices. You can define monitoring configurations—like alert rules and log queries—in JSON templates and deploy them alongside your resources using Azure Resource Manager (ARM) or Bicep. This ensures consistency and reduces manual configuration errors.
“Observability is not just about collecting data—it’s about turning that data into actionable insights.” — Microsoft Azure Documentation
Azure Monitor Metrics: Real-Time Performance Tracking
One of the most powerful features of Azure Monitor is its ability to collect and visualize metrics in real time. Metrics are lightweight, high-frequency data points that provide immediate insight into the health and performance of your resources.
Every Azure service emits a variety of platform metrics. For example, Azure Virtual Machines report CPU utilization, disk read/write operations, and network in/out. These metrics are collected automatically and can be viewed in the Azure portal, exported to external systems, or used to trigger alerts.
Types of Metrics Available in Azure Monitor
Azure Monitor categorizes metrics into three main types:
- Platform Metrics: Collected automatically by Azure for all supported services. These include performance counters like CPU, memory, and latency.
- Guest OS Metrics: Collected from inside the virtual machine using the Azure Diagnostics extension or the Log Analytics agent. These allow monitoring of processes, services, and internal system performance.
- Custom Metrics: Generated by applications or services using the Azure Monitor Metrics API. Developers can emit business-specific metrics, such as number of transactions processed or user sign-ups per hour.
Each metric comes with dimensions—additional metadata that allows for filtering and slicing data. For example, you can filter CPU usage by instance name or disk I/O by drive letter. This granularity makes it easier to pinpoint issues in complex environments.
Visualizing Metrics with Charts and Dashboards
Azure Monitor provides robust visualization tools to help you interpret metric data. You can create custom charts directly from the Metrics Explorer, applying filters, aggregations, and time ranges to focus on relevant trends.
These charts can be pinned to Azure Dashboards, which serve as centralized views for operations teams. A well-designed dashboard might include:
- Real-time CPU and memory usage across VMs
- Request rates and failure percentages for web apps
- Latency trends for databases
You can also share these dashboards with team members or embed them in internal portals. For advanced scenarios, metrics can be exported to Power BI for deeper analysis and reporting.
Additionally, Azure Monitor supports near real-time data streaming through the Metrics API, allowing integration with third-party monitoring tools like Grafana or Datadog. This flexibility ensures that Azure Monitor fits into diverse monitoring ecosystems.
Azure Monitor Logs: Deep Dive into Operational Data
While metrics give you a high-level overview, logs provide the granular detail needed for deep troubleshooting. Azure Monitor Logs, powered by Azure Log Analytics, enables you to collect, search, and analyze log data from a wide range of sources.
Logs are stored in a Log Analytics workspace—a dedicated environment where data is indexed and made available for querying using the Kusto Query Language (KQL). This makes it possible to correlate events across different systems and identify root causes quickly.
Data Sources for Azure Monitor Logs
Azure Monitor Logs can ingest data from numerous sources, including:
- Azure resources (e.g., VMs, App Services, AKS clusters)
- On-premises servers via the Log Analytics agent or Azure Monitor Agent
- Security logs from Microsoft Defender for Cloud
- Custom logs uploaded via HTTP Data Collector API
- Integration with Syslog, IIS logs, and performance counters
Once ingested, this data is parsed and structured for efficient querying. For example, web server logs can be analyzed to identify top URLs with the highest error rates, or security logs can be scanned for suspicious login attempts.
Using KQL for Advanced Log Analysis
The Kusto Query Language (KQL) is the backbone of log analysis in Azure Monitor. It’s a powerful, intuitive language that allows you to filter, transform, and aggregate log data with ease.
Here’s a simple KQL example that retrieves all error-level events from the last 24 hours:
Event
| where Level == "Error"
| where TimeGenerated > ago(24h)
More complex queries can join multiple tables, calculate trends, and even apply machine learning functions. For instance, you could write a query to detect anomalies in login patterns or forecast disk space usage based on historical trends.
Microsoft provides a rich library of sample queries and templates in the Azure portal, making it easier for beginners to get started. Over time, teams often build reusable query packs that standardize common investigations across their organization.
“KQL transforms raw logs into meaningful insights with minimal effort.” — Azure Monitor Best Practices Guide
Application Insights: Monitoring Apps with Precision
Application Insights is a key component of Azure Monitor tailored specifically for developers and application owners. It provides end-to-end transaction tracing, performance monitoring, and user behavior analytics for applications running in Azure, on-premises, or other clouds.
By integrating a small SDK into your application code, Application Insights automatically captures critical data such as HTTP requests, exceptions, dependencies (like database calls), and custom events. This data is then visualized in intuitive dashboards that help you understand how your app is performing in production.
Key Features of Application Insights
Application Insights offers several standout capabilities:
- Live Metrics Stream: View real-time telemetry from your app with sub-second latency. Ideal for monitoring deployments or debugging live issues.
- Failure Analysis: Automatically detect and group exceptions, then drill down into stack traces and affected users.
- Performance Diagnostics: Identify slow requests and see which dependencies (e.g., SQL queries) are causing bottlenecks.
- User and Session Tracking: Understand how users interact with your app, including page views, session duration, and conversion funnels.
- Availability Testing: Set up synthetic transactions to monitor uptime from global locations.
These features make Application Insights indispensable for maintaining high-quality user experiences. For example, if a new release causes a spike in 500 errors, you can immediately see which API endpoint is failing and how many users are impacted.
Setting Up Application Insights for Different Platforms
Application Insights supports a wide range of platforms, including .NET, Java, Node.js, Python, and JavaScript. Setup typically involves installing a package and configuring a connection string.
For web applications, you can add a JavaScript snippet to your pages to capture client-side telemetry. This gives you insight into browser performance, JavaScript errors, and user interactions.
In containerized environments like Kubernetes, you can deploy the Application Insights agent as a sidecar container. For serverless functions (Azure Functions), integration is automatic when you enable the feature in the portal.
Microsoft also provides integration with popular frameworks like Spring Boot and ASP.NET Core, reducing setup time and configuration overhead.
Azure Monitor Alerts: Proactive Incident Management
One of the most critical aspects of monitoring is being notified when something goes wrong—before users are affected. Azure Monitor Alerts enable proactive incident detection by evaluating metrics, logs, and activity logs against defined conditions.
Alerts can be configured to send notifications via email, SMS, voice calls, webhooks, or integration with ITSM tools like ServiceNow and Microsoft Teams. This ensures that the right people are informed at the right time.
Types of Alert Rules in Azure Monitor
Azure Monitor supports several types of alert rules:
- Metric Alerts: Triggered when a metric crosses a threshold (e.g., CPU > 90% for 5 minutes).
- Log Alerts: Based on queries run against Log Analytics data (e.g., count of failed logins > 10 in 10 minutes).
- Activity Log Alerts: Respond to changes in Azure resource configurations or service health.
- Smart Detection Alerts: Powered by AI, these detect anomalies like sudden increases in exception rates without requiring predefined thresholds.
Each alert rule can include dynamic thresholds, action groups, and suppression logic to reduce noise and avoid alert fatigue.
Best Practices for Configuring Effective Alerts
To maximize the value of Azure Monitor Alerts, follow these best practices:
- Use Action Groups: Define reusable sets of notification recipients and methods (email, SMS, webhook) to streamline alert management.
- Set Sensible Thresholds: Avoid overly sensitive rules that generate false positives. Use historical data to determine normal baselines.
- Leverage Dynamic Thresholds: For metrics with natural fluctuations (e.g., daily traffic patterns), dynamic thresholds adapt to normal behavior and reduce false alarms.
- Correlate Alerts: Use log-based alerts to combine multiple signals (e.g., high CPU + low disk space) before triggering an alert.
- Automate Responses: Integrate alerts with Azure Automation or Logic Apps to perform auto-healing actions, such as restarting a failed service.
Well-configured alerts not only improve response times but also reduce operational burden by enabling self-healing systems.
Integrating Azure Monitor with Other Tools
No monitoring tool exists in isolation. Azure Monitor is designed to integrate seamlessly with a broad ecosystem of Microsoft and third-party services, enhancing its functionality and reach.
These integrations allow you to centralize observability data, extend alerting capabilities, and enrich analysis with additional context.
Integration with Microsoft Sentinel and Defender for Cloud
Microsoft Sentinel, a cloud-native SIEM (Security Information and Event Management) solution, uses Azure Monitor Logs as its data backbone. This means all logs collected by Azure Monitor can be automatically forwarded to Sentinel for advanced threat detection, hunting, and incident response.
Similarly, Microsoft Defender for Cloud pulls security-related data from Azure Monitor to provide vulnerability assessments, secure score recommendations, and threat protection across your environment.
By combining these tools, organizations achieve a unified view of both operational and security telemetry, enabling faster detection of malicious activities and compliance violations.
Connecting Azure Monitor to External Platforms
Azure Monitor supports exporting data to various external systems:
- Azure Event Hubs: Stream logs and metrics to external analytics platforms or SIEMs like Splunk or IBM QRadar.
- Logic Apps and Power Automate: Trigger workflows based on alerts (e.g., create a ticket in Jira).
- Grafana: Use the Azure Monitor data source plugin to visualize metrics and logs in Grafana dashboards.
- REST APIs: Programmatically access metrics, logs, and alerts for custom integrations.
These capabilities make Azure Monitor a flexible hub in your observability architecture, whether you’re building a fully native Azure solution or operating in a hybrid environment.
Cost Optimization and Governance in Azure Monitor
While Azure Monitor provides immense value, it’s important to manage costs effectively. Data ingestion, retention, and query execution all contribute to your monthly bill, especially in large-scale environments.
Understanding pricing models and implementing governance policies ensures you get the most value without overspending.
Understanding Azure Monitor Pricing Models
Azure Monitor uses a consumption-based pricing model with separate charges for:
- Data Ingestion: Cost per GB of data sent to Log Analytics.
- Data Retention: Cost per GB per day for storing logs beyond the free 31-day period.
- Metrics: First 10 metrics per resource are free; additional metrics are charged per metric per month.
- Alerts: Dynamic and log-based alerts incur charges based on evaluation frequency and volume.
To estimate costs, Microsoft provides the Azure Pricing Calculator, which allows you to input expected data volumes and retention periods.
Strategies for Reducing Azure Monitor Costs
To optimize spending, consider the following strategies:
- Filter Data at Source: Use data collection rules to exclude unnecessary logs (e.g., verbose debug messages).
- Adjust Retention Periods: Reduce retention from 365 days to 90 days for non-critical logs.
- Use Diagnostic Settings Efficiently: Route only essential logs to Log Analytics; send others to cheaper storage like Azure Storage or Event Hubs.
- Monitor Query Usage: Identify and optimize expensive KQL queries that scan large volumes of data.
- Enable Compression and Sampling: For high-volume applications, use sampling in Application Insights to reduce telemetry volume while preserving statistical accuracy.
Regular audits using Azure Cost Management + Billing can help identify cost outliers and enforce budget alerts.
Getting Started with Azure Monitor: A Step-by-Step Guide
Ready to implement Azure Monitor in your environment? Here’s a practical roadmap to get you started:
Step 1: Define Your Monitoring Objectives
Before diving into configuration, clarify what you want to achieve. Common goals include:
- Improving application uptime
- Reducing mean time to resolution (MTTR)
- Ensuring compliance with SLAs
- Detecting security threats early
These objectives will guide your data collection strategy and alerting policies.
Step 2: Set Up a Log Analytics Workspace
The Log Analytics workspace is the central repository for your log data. To create one:
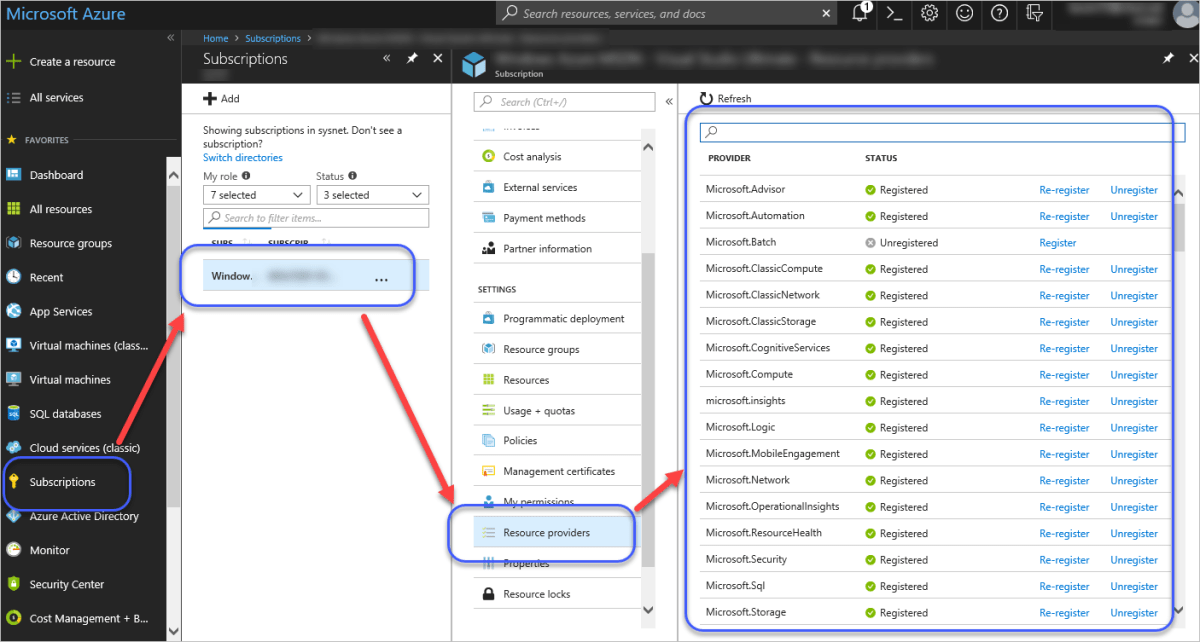
- Go to the Azure portal.
- Navigate to Log Analytics workspaces.
- Click Create and specify the subscription, resource group, region, and workspace name.
- Configure data retention and enable resource logs if needed.
Once created, you can start connecting resources to this workspace.
Step 3: Enable Monitoring for Key Resources
Start by enabling monitoring for critical workloads:
- Virtual Machines: Install the Azure Monitor Agent and configure data collection rules.
- App Services: Enable Application Insights in the portal or via ARM templates.
- Azure Kubernetes Service (AKS): Deploy the Container Insights solution to monitor cluster health.
- Logic Apps and Functions: Turn on diagnostic logging to capture execution details.
Use Azure Policy to enforce monitoring configurations across your organization.
Step 4: Create Dashboards and Alerts
Build custom dashboards to visualize key metrics and logs. Then, set up alerts for critical conditions:
- High CPU or memory usage
- Application error spikes
- Failed login attempts
- Service outages
Test your alerts to ensure they trigger correctly and notify the right teams.
Step 5: Review, Optimize, and Scale
After initial deployment, regularly review your monitoring setup:
- Analyze alert effectiveness—reduce false positives.
- Optimize KQL queries for performance.
- Adjust data collection based on cost and relevance.
- Scale monitoring to new workloads as your environment grows.
Continuous improvement ensures your observability strategy evolves with your business needs.
What is Azure Monitor used for?
Azure Monitor is used to collect, analyze, and act on telemetry data from cloud and on-premises environments. It helps ensure application performance, infrastructure health, and operational efficiency through metrics, logs, alerts, and visualizations.
How does Azure Monitor integrate with Application Insights?
Application Insights is a component of Azure Monitor that focuses on application performance monitoring. It sends telemetry data (requests, exceptions, dependencies) to Azure Monitor, where it can be queried, visualized, and alerted on using the same tools and infrastructure.
Is Azure Monitor free to use?
Azure Monitor offers a free tier with limited data ingestion and retention. However, most production scenarios incur costs based on data volume, retention period, and feature usage. You can use the Azure Pricing Calculator to estimate expenses.
Can Azure Monitor monitor on-premises servers?
Yes, Azure Monitor can monitor on-premises servers using the Azure Monitor Agent or Log Analytics agent. These agents collect performance data, event logs, and custom metrics, sending them securely to a Log Analytics workspace in Azure.
How do I reduce costs in Azure Monitor?
To reduce costs, filter unnecessary data at the source, adjust log retention periods, use diagnostic settings efficiently, optimize KQL queries, and leverage sampling in Application Insights. Regular cost reviews using Azure Cost Management are also recommended.
Mastering Azure Monitor is essential for any organization leveraging Microsoft Azure. From real-time metrics to deep log analysis, proactive alerts to seamless integrations, it empowers teams to maintain high-performing, secure, and reliable systems. By following best practices in setup, cost management, and continuous optimization, you can unlock the full potential of your cloud environment. Whether you’re a developer, operations engineer, or security analyst, Azure Monitor provides the tools you need to stay ahead of issues and deliver exceptional digital experiences.
Recommended for you 👇
Further Reading: